Premium Markets, Free stock market Forecast, Market Trend Analysis, Investment outlook, Buy Sell signals, Sector Rotation and Technical Analysis
Note to the reader:
The stand-alone application includes a full integration of ta-lib C/C++ libraries.
It does NOT include the forecast engine.
This application is mainly used by its author as an MVP (Minimum Viable Product) to test the forecast engine and its related features.
Take a look at the latest prediction engine based on technical analysis.
Premium Markets stand-alone App
The stock market forecast is based on technical analysis of individual stocks or markets,
as well as on sectors and markets indices rotation and stock markets performances.
This trend forecast software ought to help you, as a stock market beginner or as an advanced investor, in stock market screening, performance projections,
market analysis and ultimately in finding the best future stocks and shares for your swing or long term investments.
Premium Markets also offers stocks buy sell signals monitoring via buy and sell signals sent through email notifications or other means.
The stock market forecast engine is available as a free workable demo online
and also as a stand-alone application. The latter including additional features like
price historical data charting, price trend monitoring, financial technical analysis indicators and oscillators editing and managing stock portfolios.
Be Premium Markets a free addition to your stock market watch and stock market trend analysis.
History
A few years ago - around 2012 -, as seeking to find a free financial technical analysis tool that would fit my needs
(i.e. generating buy and sell signals based on stock market historical data and technical analysis), I decided to implement my own solution.
With the assent of AI, this eventually lead to the development of a forecast engine also based on technical analysis.
Download and Install
The following installation notes may not be fully up to date as the resulting artifact (.jar) went out of date.
For an update,
it is recommended to use the source code instead:
at sourceforge.net
or at github.com.
Premium Markets is java based and requires version 11 or higher.
Please, do check that you have an up to date version of java installed.
To access Yahoo quotation data, you will also need python3 and the additional packages through:
pip install yfinance requests pandas
The path of your python3 executable can be changed after installation.
In the db.properties file, you will be able to set your own python executable path: quote.pythonPath=C:/../../python3.exe
Installation
If any issue, please contact Gheeyom. Thanks
Release notes
Premium Markets stand-alone App is an automated stock market analysis system.
It implements a graphical environment for monitoring and editing stock market technical analysis indicators and oscillators, generating signals, back testing, managing portfolios and charting.
In its advanced packaging, not provided under this license, it also includes:
- Screening of financial web sites to pick up the future best stocks and shares,
- Price trend prediction and forecast based on stock market technical analysis and indexes and sectors rotation.
Features Overview
Charting
Premium Markets offers charting for EOD quotations of user defined portfolios.
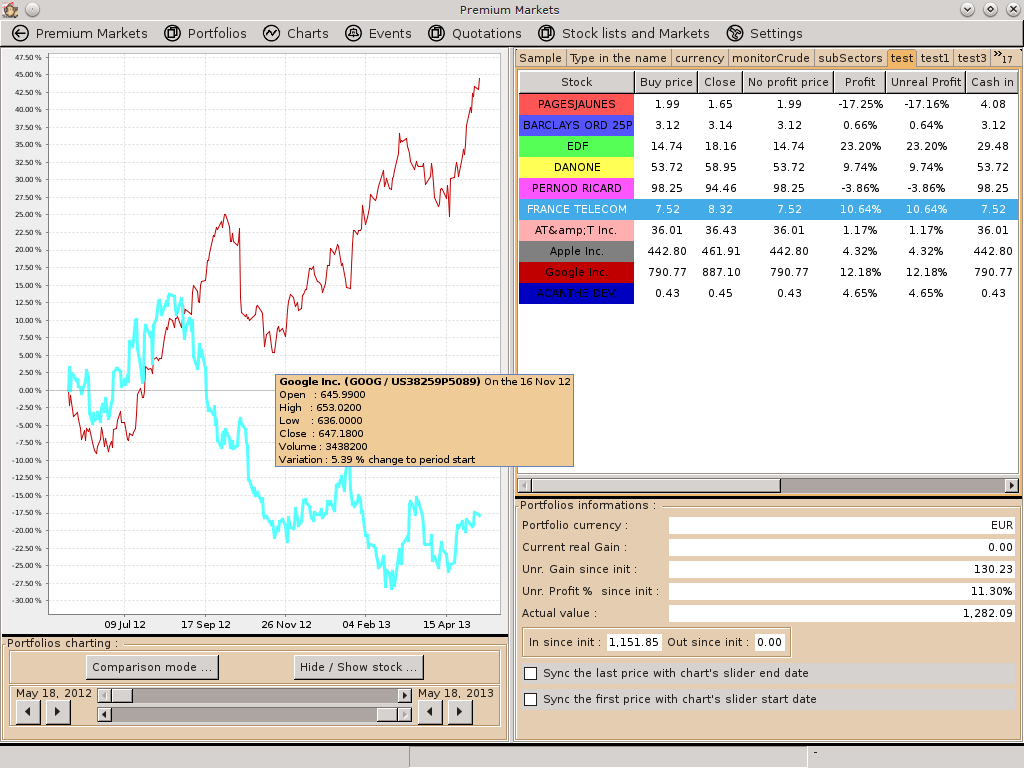
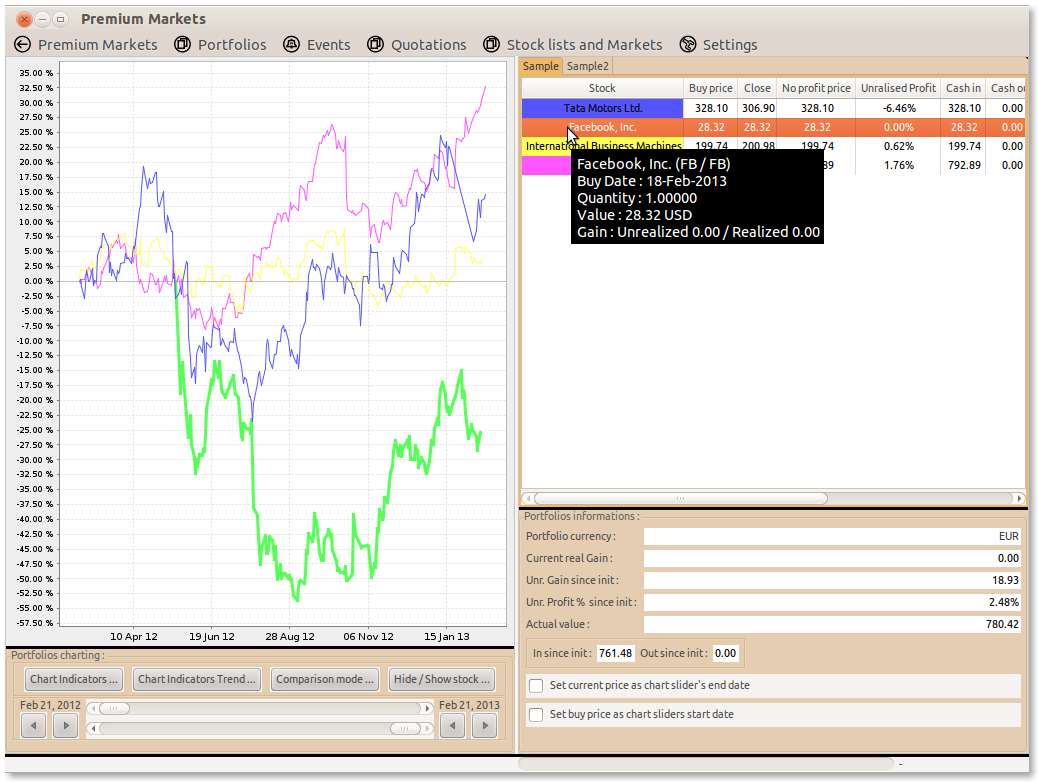
The quotations representation can be set relative giving the ability to compare the performance of stocks against each other within a portfolio.
Quotation charting can be set in various ways
- relative to an other stock or index acting as a referee.
- relative to their buy price or to a specific root start date.
- relative to the previous day on a day to day basis (alike the ROC)
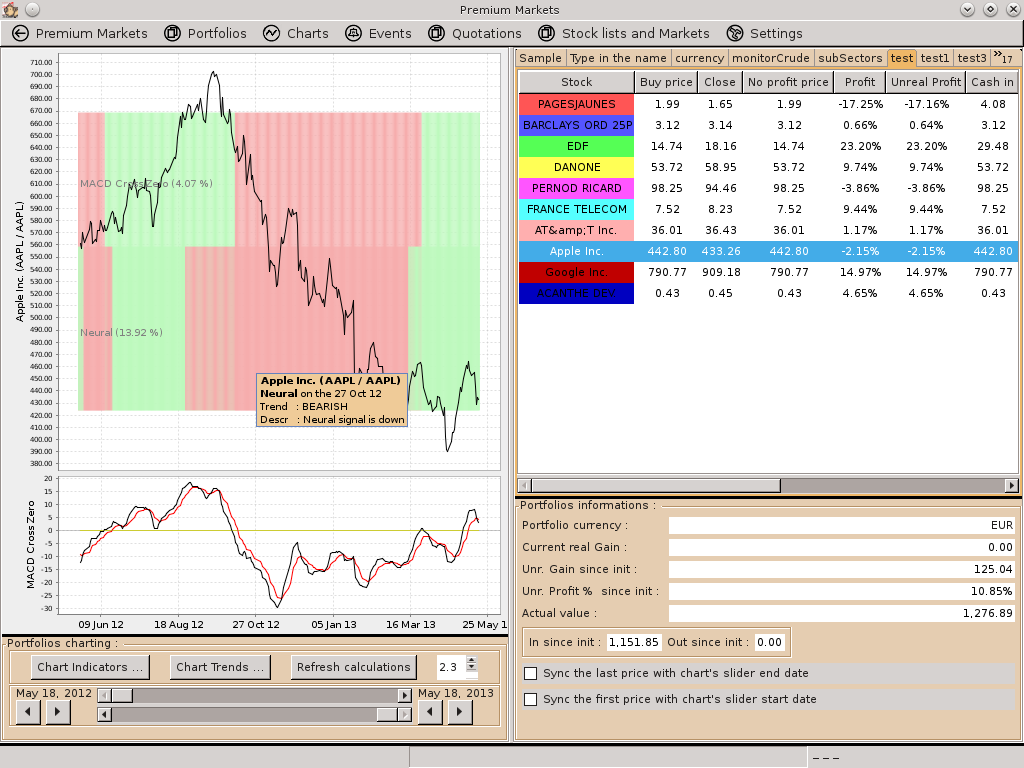
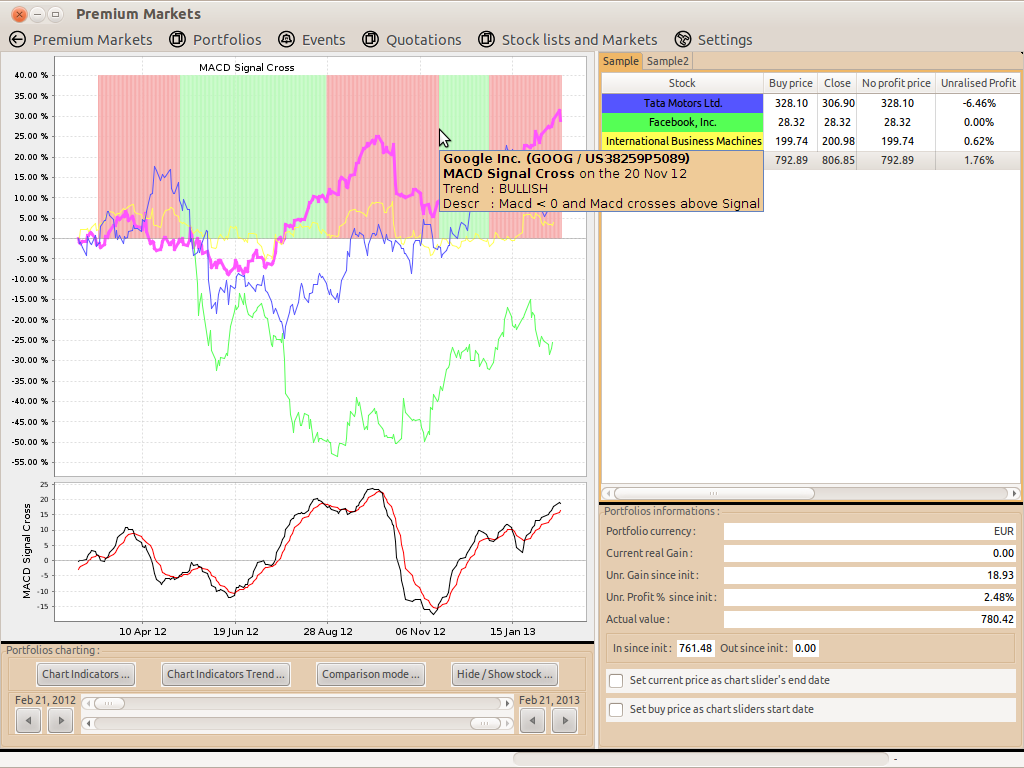
You will also be able to chart technical analysis indicators and oscillators and their buy and sell signals. In its advanced version Premium Markets also displays the results of a neural network based forecasting analysis.
Native indicators and oscillators
Parametrise and create you own indicators
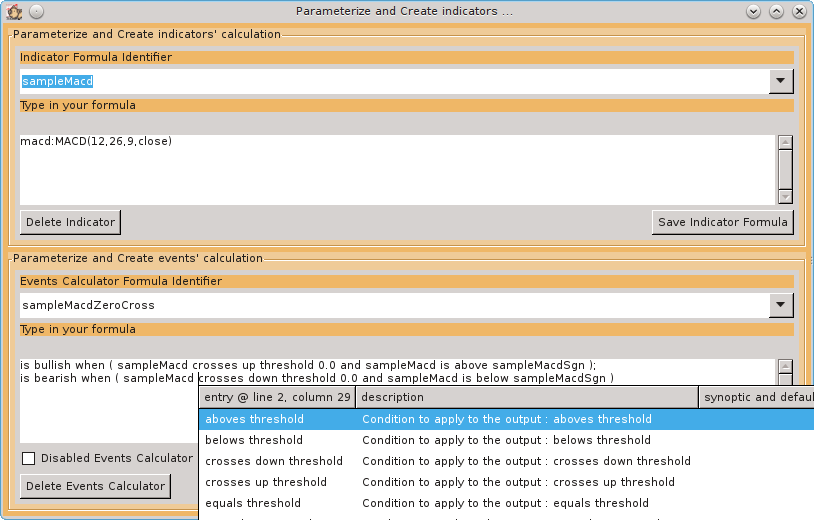
With Premium Markets you can edit and create your own indicators as a composition of more than a hundred common technical analysis functions.
You first specialise one or several indicators by parametrising and making composition of existing technical analysis functions.
You then can use these indicators to create an event calculator formula with bullish and bearish conditions.
In order to make it easier we also provide command completion and suggestions.
In this example, we have created two indicators:
- sampleMacd with the following formula:
macd:MACD(12,26,9,close) - sampleMacdSgn with the following formula:
macd:MACDSignal(12.0,26.0,9.0,close)
The former will calculate the Macd and the latter its signal.
We can then use them to create an event calculator that will trigger events on Macd zero crossing and signal crossing as follow:
is bullish when ( sampleMacd crosses up 0.0 and sampleMacd is above sampleMacdSgn );
is bearish when ( sampleMacd crosses down 0.0 and sampleMacd is below sampleMacdSgn );
Premium market as a technical analysis indicator editor also provides a more advanced grammar for more flexibility. It comes with additional keywords like : spanning, over and for. When it makes sense, adding these keywords will change the result as follows:
- spanning n days : will be used for condition involving events happening over time like when comparing two status of the data at two points in time.
- over n days : means that the condition happened at least once over the past n days. It could as well not be true any more at the current date.
- for n days : means that the condition was true for n days in a row.
For instance close crosses up 10 spanning 3 days means that close was below 10 three days ago and close is now above 10.
Keyword can also be combined as in the following :
- close crosses up 10 spanning 2 days over 30 days : means that the close price has crossed up 10 sometime over the past 30 days in a span of 2 days.
- volume goes up more than 0% spanning 3 days over 10 days : means that the volume goes up more than 0% sometime over the past 10 days in a span of 3 days.
- chaikinOsc is below 0 over 3 days for 10 days : means that the chaikin oscillator (if predefined as an indicator) has been below 0 for 10 days in a row sometime over the past 3 days.
| Condition | spanning | over | for |
|---|---|---|---|
| above, below, equals threshold | Does not make sense. As the condition is a status in time not an event in time. | OK | OK |
| above, below, equals historical data | Does not make sense. As the condition is a status in time not an event in time. | NA | OK |
| crosses up, down threshold | OK | OK | Does not make sense. As the condition is an event in time not a status in time. |
| goes up, down % | OK | NA | OK |
| crosses up, down historical data | OK | OK | Does not make sense. As the condition is an event in time not a status in time. |
| high and lows | OK | NA | NA |
| Reverses up, down | OK | NA | Does not make sense. As the condition is an event in time not a status in time. |
- not every condition implements all the keywords. This is also because it doesn't always make sense. See the current availability of keywords, at the time of writing this in this table.
- keywords must be inserted in this order : spanning, over and for. Omitting those which are not available for a particular Condition.
- days above mean calendar open days, not quotation availability days.
- these additional keywords are not included in the auto completion (yet?) and need to be typed in in full. All available or none must be specified.
Markets, Stock lists and Quotations
In order to populate your portfolio content, you will first need to upload stock lists of your choice and their quotations.
With Premium Markets you can download EOD quotations from various service providers. The main quotation provider being yahoo.
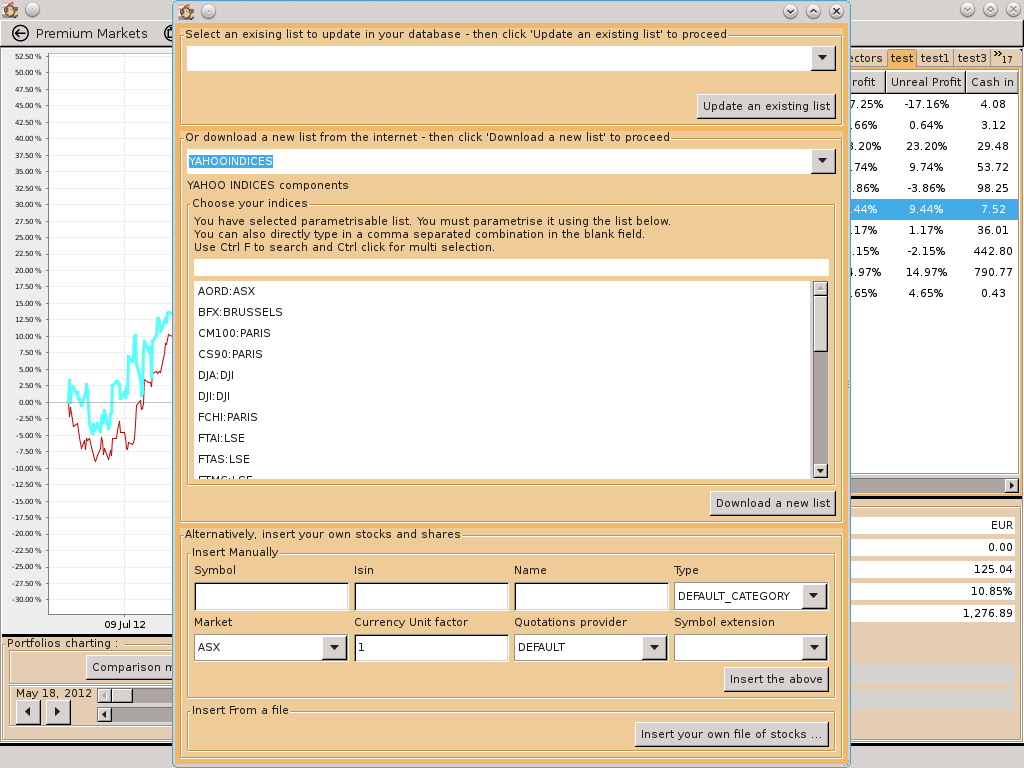
You can manage existing stock lists, created over previous market selections, or download new ones from the net.
You can also upload your own lists provided you create a file in the specified format. Finally you can add a new share manually using the provided form.
In the Quotations
menu you can refresh the quotations for the shares available in your portfolios as well as download advisor's recommendations in the advanced version.
Portfolios
In the right sash window each tab contains a portfolio. You can
add and remove portfolios and in each of these add and remove shares.
You
can see the quotations historical data for each share in the left hand side quotations charting window.
The quotation historical data can be displayed in various manner including relative to the buy price or to the history of another preselected share acting as a reference.
The portfolio feature offers the possibility to load and export advanced report from gnucash.
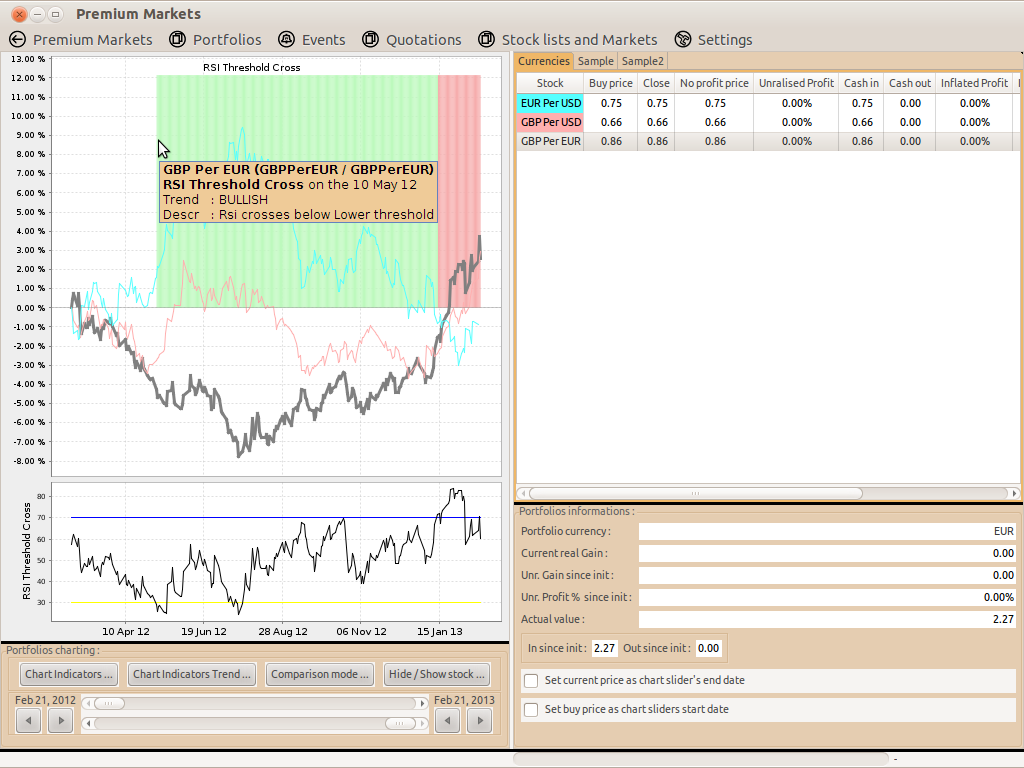
Currencies
Premium Markets also provides technical analysis on currencies relative price change.
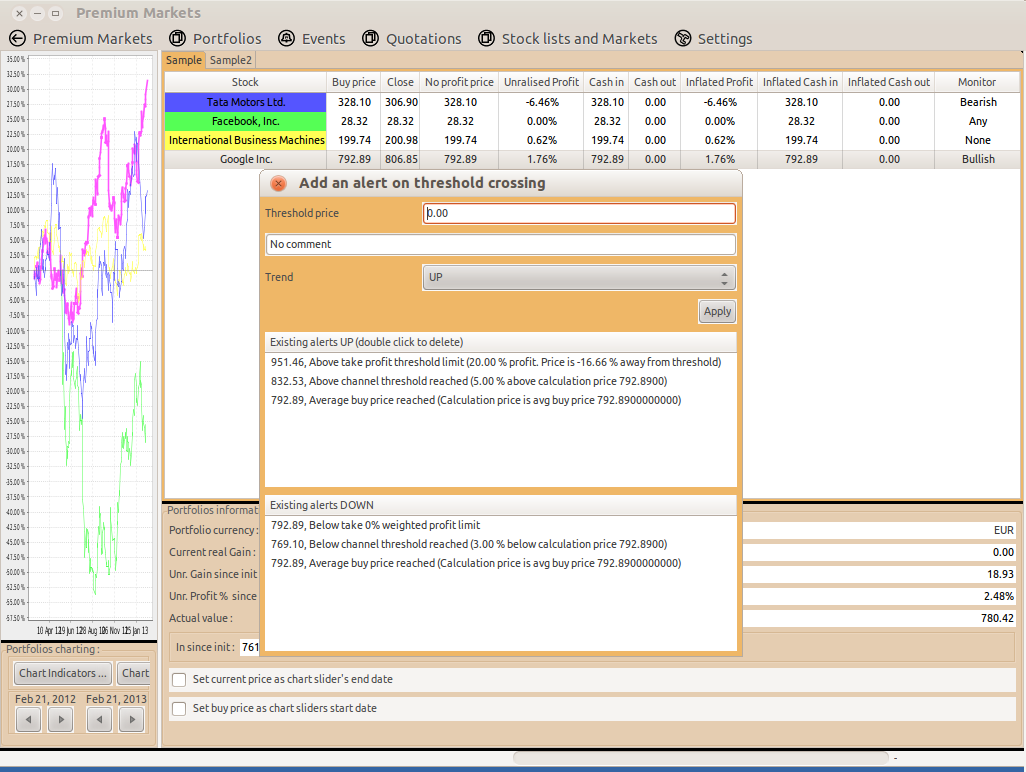
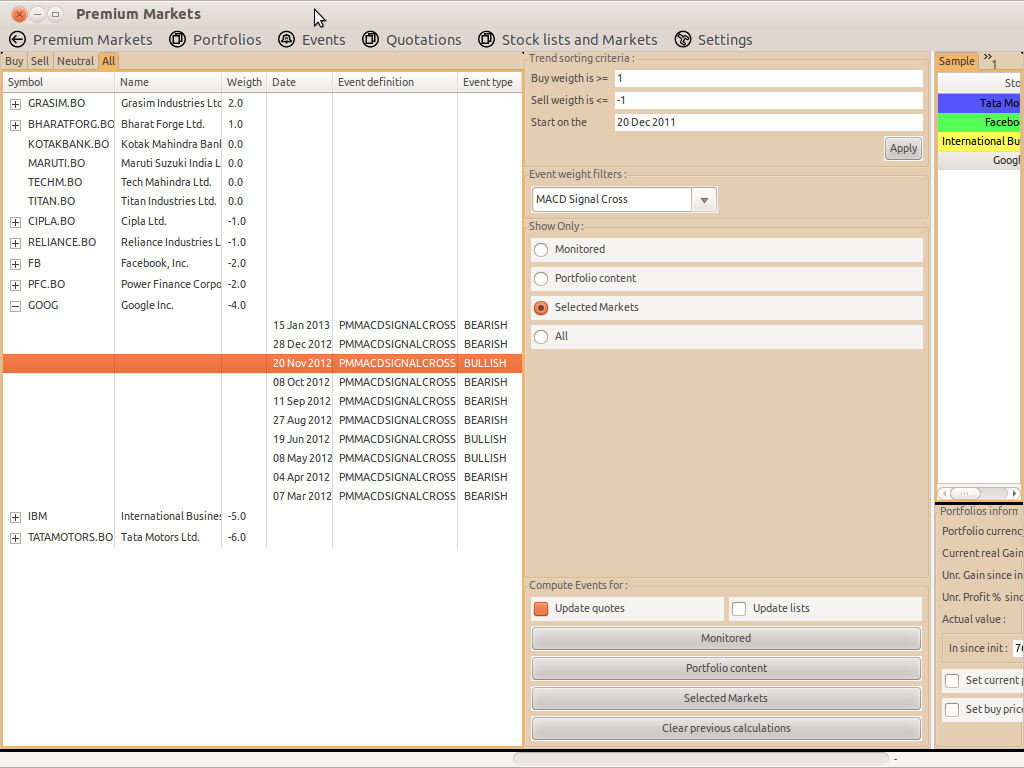
Events
In the events
sash window, we show a tree view of the events triggered for the currently selected set of stocks since the start date specified in the left column.
The events are sorted in different tabs : selling, buying and neutral events.
The weight thresholds and the calculation mode of the events are based on signal indicators. They can be calculated, filtered and refined in the left hand menu tool box.
Other screenshots
Trade Automation and Forecast
The stand-alone App, in its advanced version, also includes an automation service and a forecast engine, it is not included with the open-source stand-alone app.
With the advanced version, you can set up your portfolios but also use the auto screened portfolios. Screened portfolio contents are updated following financial advisor's and expert's recommendations from divers Internet sources. Portfolios are then automatically updated and managed according to buy sell signals based on technical analysis, trend projection and your threshold settings.
For more see also
For more information about the calculation please refer to Premium Markets.
For requests and comments, use the contact.
Hosting and Development
Hosting and developing a cloud-based application without harvesting personal data can be costly.
If you found this site interesting or useful, please consider supporting us to keep it alive.
Disclaimer
This project is a Demo/MVP and is free. It is not intended to be used for financial advice.
All information provided is for educational purposes only.
Credentials
SSL Trust Verified.

Original since 2013