Premium Markets, Free stock market Forecast, Market Trend Analysis, Investment outlook, Buy Sell signals, Sector Rotation and Technical Analysis
The stock market trend forecast engine
Premium Markets is a free stocks and shares price trend prediction engine base on neural networks.
The stock market forecast is mainly based on technical analysis of individual stocks or markets.
Demo available on this site.
This trend forecast software ought to help you, as a stock market beginner or as an advanced investor, in stock market screening, performance projections,
market analysis and ultimately in finding the best future stocks and shares for your swing or long term investments.
In its final iteration, Premium Markets offers stocks buy sell signals monitoring via buy sell notifications sent via email.
This public web site engine is available as a free proof of concept and as an online demo.
It also is available as a stand-alone application. The latter includes additional features like
price historical data charting, trends monitoring, financial technical analysis, indicators editing and stock portfolios management.
Please don't hesitate to enquire if you are interested or want to know more.
May Premium Markets enhance your stock market watch and stock market trend analysis.
How does it work?
If the next price of a share may be impossible to predict in an accurate manner, it may, however, be possible to forecast the trend a share price will take in its near future. Knowing the trend, one can aim at buying near the lowest price and selling near the highest price. Premium Markets offers a forecast engine based on historical data analysis. The engine aims at finding what the next trend of a chosen market, specific share or set of shares will be. In other words if the subjacent is bullish or bearish.
Using Financial Technical Analysis
The main issue faced using technical analysis is that it seems difficult to master without many experiments, back testing, practice, knowledge and as many failures.
Difficult, indeed, to find out in an accurate manner what a signal or set of signals really means regarding the trend a stock price will follow.
The Premium Markets forecast engine is here to try and answer this issue and give everybody the ability to leverage technical analysis without necessarily knowing that much about it.
Principle of the calculation:
- First, we analyse historical stock's prices using a set of technical analysis indicators and oscillators and a set of selected stocks.
- Then, for our target stock, we define a desired output as a function of the historical stock prices (this could for instance be an SMA shifted to the left to correct its lag).
- The technical analysis is then used as input of a neural network engine, in a process of supervised training.
- After training, we can use the trained network and inject it with new daily technical analysis from any stock.
- The neural network will give us the predicted output trend for this new input (in this example, an SMA with its lag fixed).
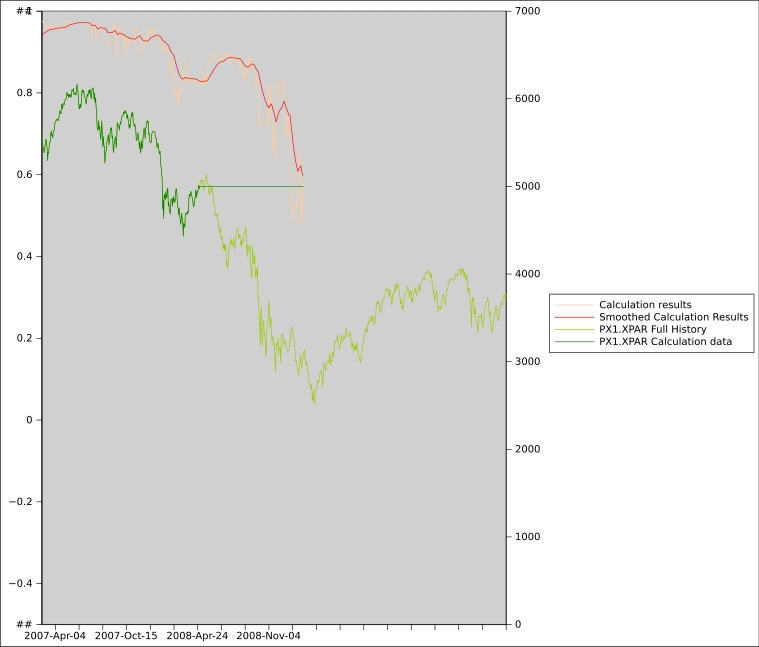
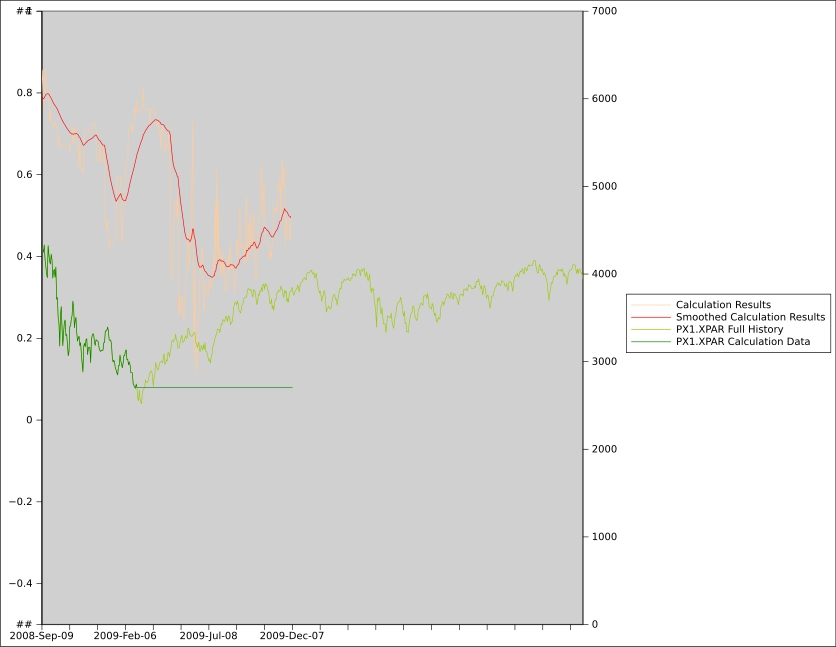
When back tested on historical data, the calculation results give us a curve similar to the desired output, this will be an SMA in the following illustration. In reality, the SMA, calculated with live data, is lagging behind the quotations. This makes it unusable in a volatile market.
This why our prediction is different.
We don't need the actual SMA nor the stock price as input, but just a set of signals and calculations results derived from the daily market data. Hence we predict the future SMA of the stock price without direct knowledge of its actual price and trend.
Comparing the prediction against Moving Averages (MAs) like SMA and WMA
To get a better understanding, in the following charts we compare the forecast output out of the BTC-USD with the a SMA and WMA 50 applied on the BTC-USD prices.
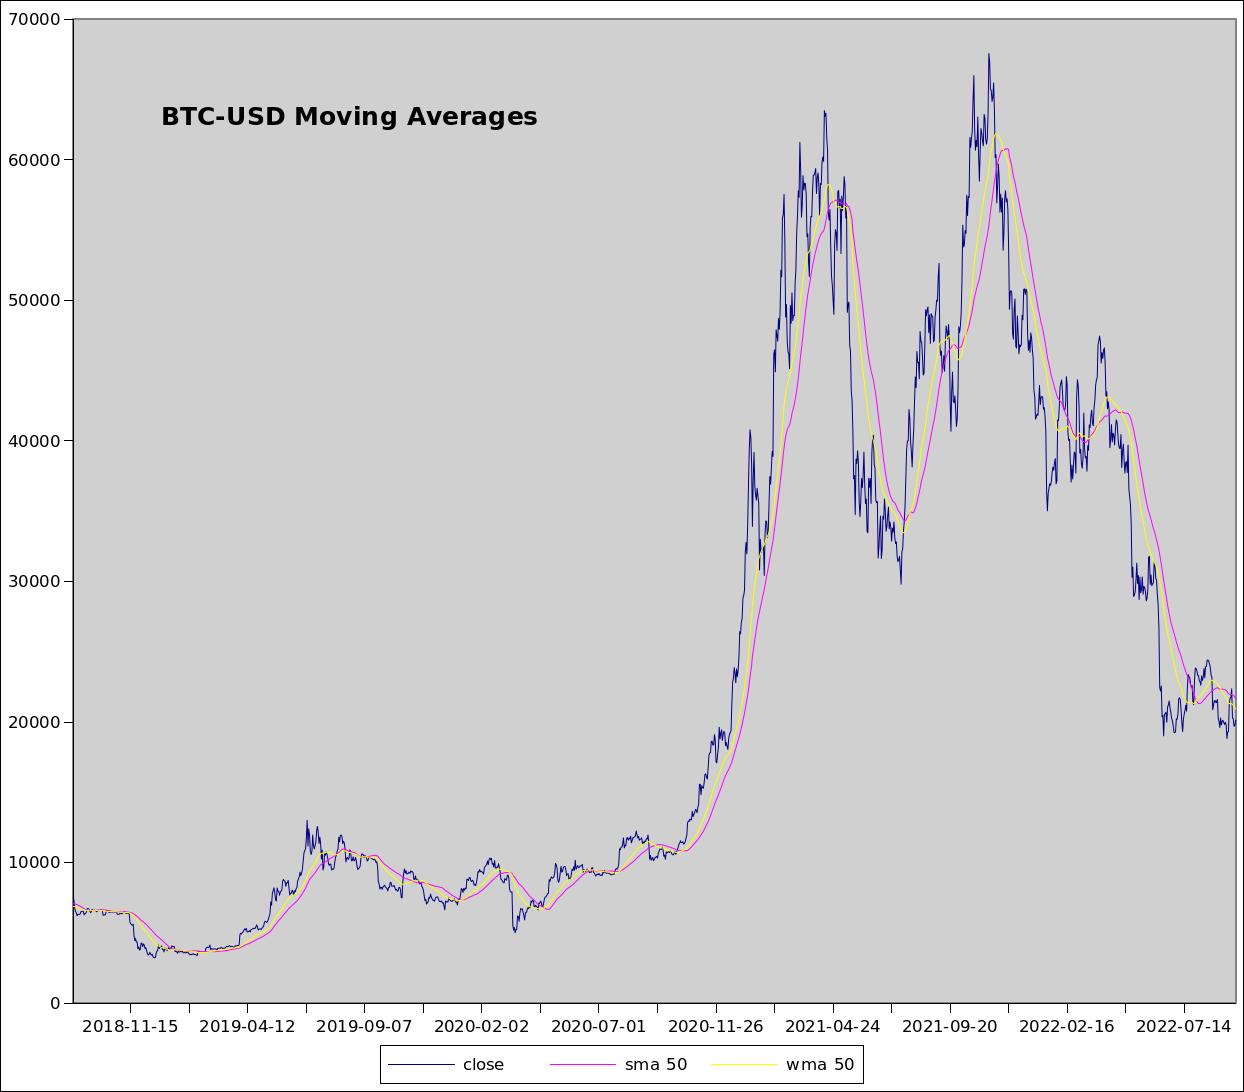
The dark blue line is the stock price.
In yellow and pink are the SMA and WMA 50.
As you can see, and this is well known, both MAs are lagging behind the real trend (of about 25 days).
A longer SMA period gives a better match with longer trends and a shorter one with shorter trends. But both are lagging of about half a period.
As you will see in the next chart, the neural network output calculated by Premium Markets aims at answering the lagging issue.
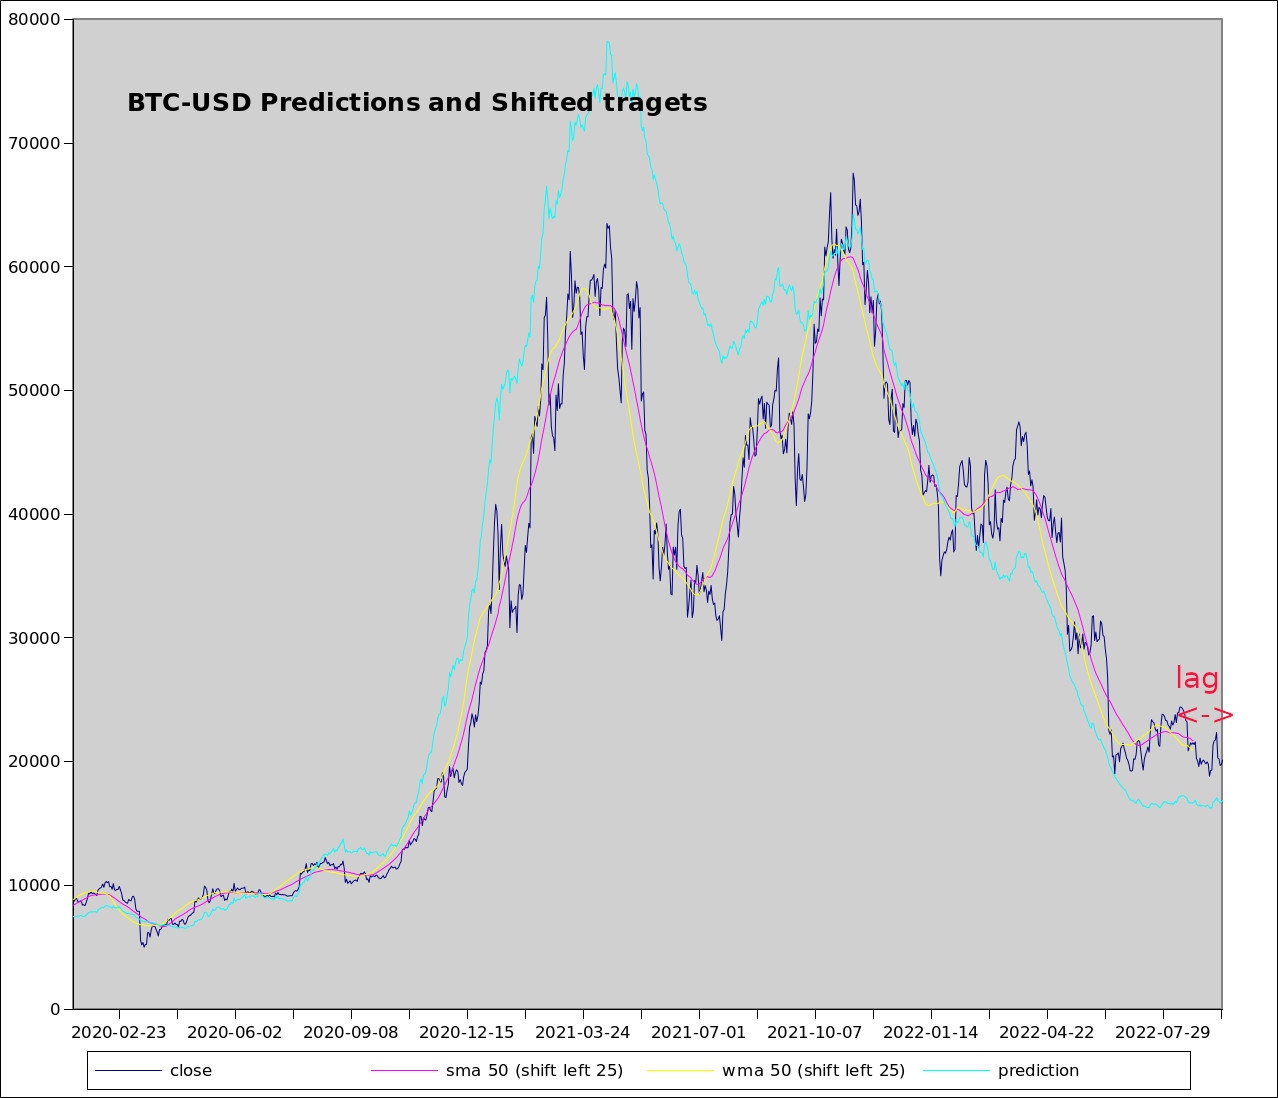
In this chart, we have 'fixed' the MAs lags by artificially shifting them 25 days in the past, letting the resulting MAs to display a better representation of the trend indeed.
The issue is now that, by shifting left, we are missing the most recent and important 25 days... This is what we call the lag.
In comparison, the output calculation from Premium Markets solves this issue.
As show by the light blue line, the trend line prediction issued from the forecast.
- The prediction redraws the shifted MAs with a head start, reducing the lag.
- The generation of false positive signals is mitigated by a smooth curve inherent to MAs.
- The trend is drawn until the last day of quotation available, a prediction of the future MAs.
Bullish or Bearish: buy and sell signals
As seen above, the output is in fact drawing a smooth line of the stock price trend but without the lag that you would actually get with other smoothing techniques. By redrawing a smooth trend line of the quotation line, the output from the neural network will tell us if the share is following a bullish or a bearish trend.
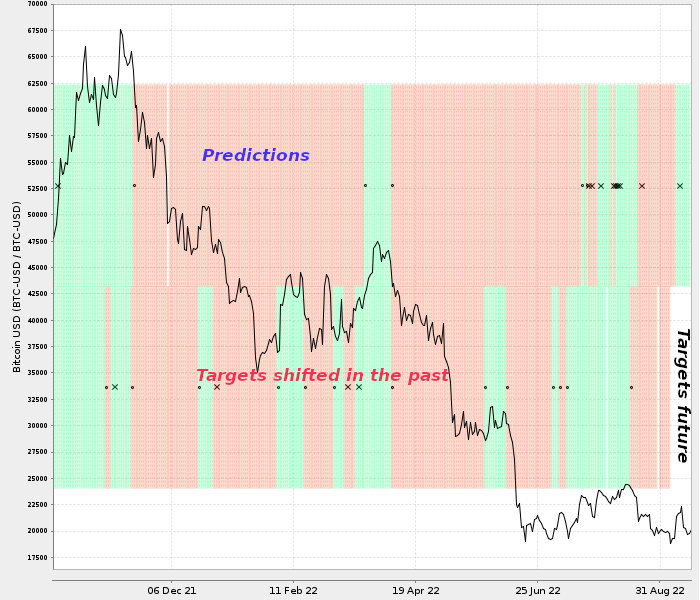
In this sample chart, the green and red bars draw an interpretation of the trend line indicating respectively bullish and bearish trends.
In the top bars, we have the predictions and in the bottom bars, the targets.
Here the interpretation is simply based on the trend line going up or down. Its reversals used as buy and sell signals.
In this particular example, the forecast enabled us a good 10% profit as the stock price goes down -60%.
It may be worth mentioning that a finer interpretation can be made for each prediction.
For instance considering the slop and velocity, considering acceleration and deceleration of the trend, adding delays or using stop losses.
About the Neural networks at play
The concept was experimented with different neural network models and prototypes.
Using alternatively 2D coloured image and time sliding windows or simple time series.
As neural network engine, we used in the beginning the, then excellent,
Neuroph and Encog, and now TensorFlow then PyTorch.
On this site you will can also find a live demo of Premium Markets trend prediction concept. Premium Markets also offers an email notifications service for trend and market watch.